Mapping Your Visited Countries
You might have realized that I loved to travel from my Biography. Up until now, I have kept a list of the countries I have visited in the Notes app on my phone. Today, I thought to myself: “What if I combined my passion for traveling and R?” Let’s make a map of the countries I have visisted.
There are many different ways to make maps in R (I even explained how to use leaflet to make interactive ones in a recent article) but for this map we will stay simple and use ggplot2. Heck, it will even be useful practice with the most used data visualization package. On top of that, we will use the maps package, which contains a lot of outlines of continents, countries, states, and counties. These are all the packages:
library(ggplot2)
library(dplyr)
library(maps)
library(knitr)
We are going to use the “world” argument in the map_data function. This will turn data from the maps package into a data frame suitable for plotting with ggplot2. Here is a look at what it looks like:
world_map <- map_data("world")
head(world_map) %>% kable()| long | lat | group | order | region | subregion |
|---|---|---|---|---|---|
| -69.89912 | 12.45200 | 1 | 1 | Aruba | NA |
| -69.89571 | 12.42300 | 1 | 2 | Aruba | NA |
| -69.94219 | 12.43853 | 1 | 3 | Aruba | NA |
| -70.00415 | 12.50049 | 1 | 4 | Aruba | NA |
| -70.06612 | 12.54697 | 1 | 5 | Aruba | NA |
| -70.05088 | 12.59707 | 1 | 6 | Aruba | NA |
From there we have to manually create a vector with the countries we have visited and conveniently call it countries_visited:
countries_visited <- c("Antigua", "Argentina", "Austria", "Bahamas", "Belgium",
                       "Brazil", "Canada", "Costa Rica", "Cayman Islands",
                       "Czech Republic", "Denmark", "Dominican Republic",
                       "France", "Germany", "Hungary", "Israel", "Italy",
                       "Jamaica", "Jordan", "Luxembourg", "Mexico", "Monaco",
                       "Morocco", "Netherlands", "Norway", "Portugal", "Puerto Rico",
                       "Saint Kitts", "Spain", "Sweden", "Switzerland", "Turkey",
                       "UK", "USA", "Vatican", "Virgin Islands")
You can always check the spelling and list of countries in the world_map dataframe with unique(world_map$region). (It is important that the spelling is the same for the next step)
We now create a new variable in the world_map dataframe called visited which equals to 1 if you have visited the country and 0 otherwise:
world_map$visited <- as.factor(ifelse(world_map$region %in% countries_visited, 1, 0))
head(world_map) %>% kable()| long | lat | group | order | region | subregion | visited |
|---|---|---|---|---|---|---|
| -69.89912 | 12.45200 | 1 | 1 | Aruba | NA | 0 |
| -69.89571 | 12.42300 | 1 | 2 | Aruba | NA | 0 |
| -69.94219 | 12.43853 | 1 | 3 | Aruba | NA | 0 |
| -70.00415 | 12.50049 | 1 | 4 | Aruba | NA | 0 |
| -70.06612 | 12.54697 | 1 | 5 | Aruba | NA | 0 |
| -70.05088 | 12.59707 | 1 | 6 | Aruba | NA | 0 |
Finally, we are ready to create our map. We will use the geom_polygon function and fill the countries according to the visited variable we made earlier. Here is the map:
ggplot(world_map, aes(x = long,y = lat, group = group)) +
  geom_polygon(aes(fill = visited), color = "white") +
  scale_fill_manual(values = c("lightgray","dodgerblue3")) +
  theme_void() +
  theme(legend.position = "none")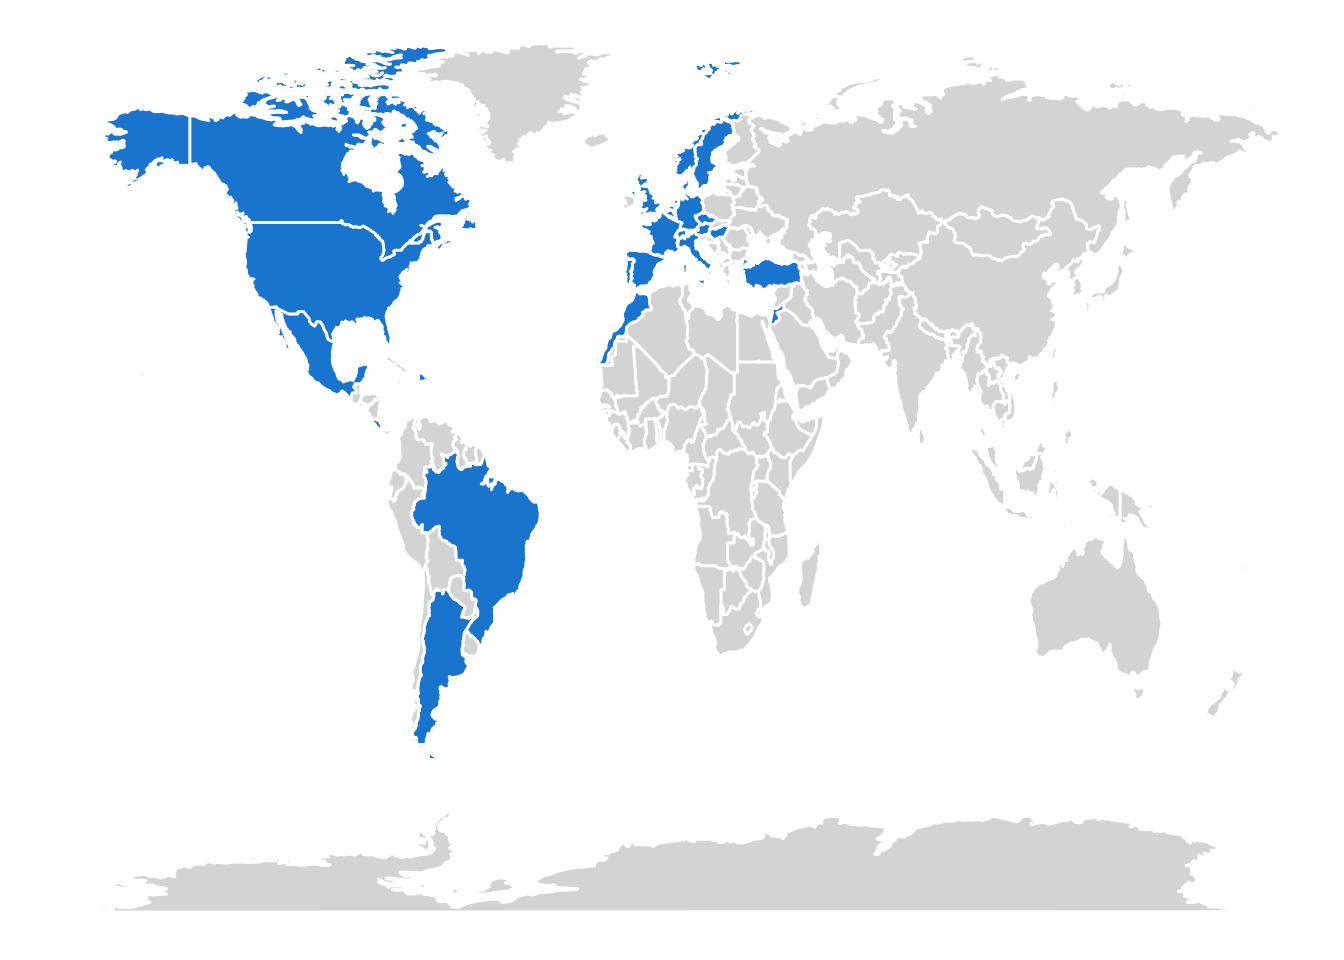
I also chose specific colors and removed the background and legend to make it more visually appealing, but feel free change the arguments to your preference.
If we want to go even further, we can make a list of all the countries with this code:
countries <- world_map %>%
  filter(visited == 1)
sort(unique(countries$region))
## [1] "Antigua" "Argentina" "Austria"
## [4] "Bahamas" "Belgium" "Brazil"
## [7] "Canada" "Cayman Islands" "Costa Rica"
## [10] "Czech Republic" "Denmark" "Dominican Republic"
## [13] "France" "Germany" "Hungary"
## [16] "Israel" "Italy" "Jamaica"
## [19] "Jordan" "Luxembourg" "Mexico"
## [22] "Monaco" "Morocco" "Netherlands"
## [25] "Norway" "Portugal" "Puerto Rico"
## [28] "Saint Kitts" "Spain" "Sweden"
## [31] "Switzerland" "Turkey" "UK"
## [34] "USA" "Vatican" "Virgin Islands"We can also get R to count the number of countries we have visited like this:
paste("Number of Countries Visited:", length(unique(countries$region)), "countries")## [1] "Number of Countries Visited: 36 countries"If you want to make your own, all you have to do is adjust the countries_visited vector. I hope this article helped you to draw a world map with the countries you visited in R and gave you an understanding of how ggplot works.
As always, if you have a question or a suggestion related to the topic covered in this article, please feel free to contact me!