Which NBA Teams Are Best At Drafting?
Every season, countless hours are spent scouting and evaluating players, determining team needs, and making mock drafts. After all, the draft is supposedly the great equalizer. The Cleveland Cavaliers were the worst team in the NBA in the ’02-’03 season, drafted LeBron James that spring in the ’03 draft, and were playing in the NBA Finals four years later. A great draft pick can radically change the tides of an NBA franchise.
Nothing defines the success of a team in the NBA quite like the NBA draft; the draft represents the one time a year where a team is solely responsible for the talent that comes their way. Other options of talent acquisition, like trades and free agency, depend on external conditions: location, salary cap, relationships between players, the list goes on. However, the draft is what separates the great teams from the pack, and allows for sustained success beyond just one generation of players is consistent and successful drafting.
One of the most prolific NBA teams in the past decade has been the Boston Celtics, missing the playoffs only once in the past 14 seasons and reaching the Eastern Conference Finals a whopping six times in that time frame. This incredible run was fueled by a series of strong draft picks to fill in gaps and continuously strengthening the team. On the opposite end of the spectrum, the Sacramento Kings have now missed the playoffs for 15 straight seasons — also tying an NBA record. Unsurprisingly, this analysis shows the Kings as one of the worst drafting teams. In order for a team to maintain its prowess they must find high value players that can create impact in their first season.
In this analysis, I have created a metric that scores each draft pick by comparing them against the players drafted after (full methodology is available at the end of the article). The score of each player depends not just on their performance, but on what teams gave up to select them. After applying this analysis over the last 12 NBA drafts (from 2009 to 2020), clear differences emerge between teams that consistently draft well versus those that do not.
Results
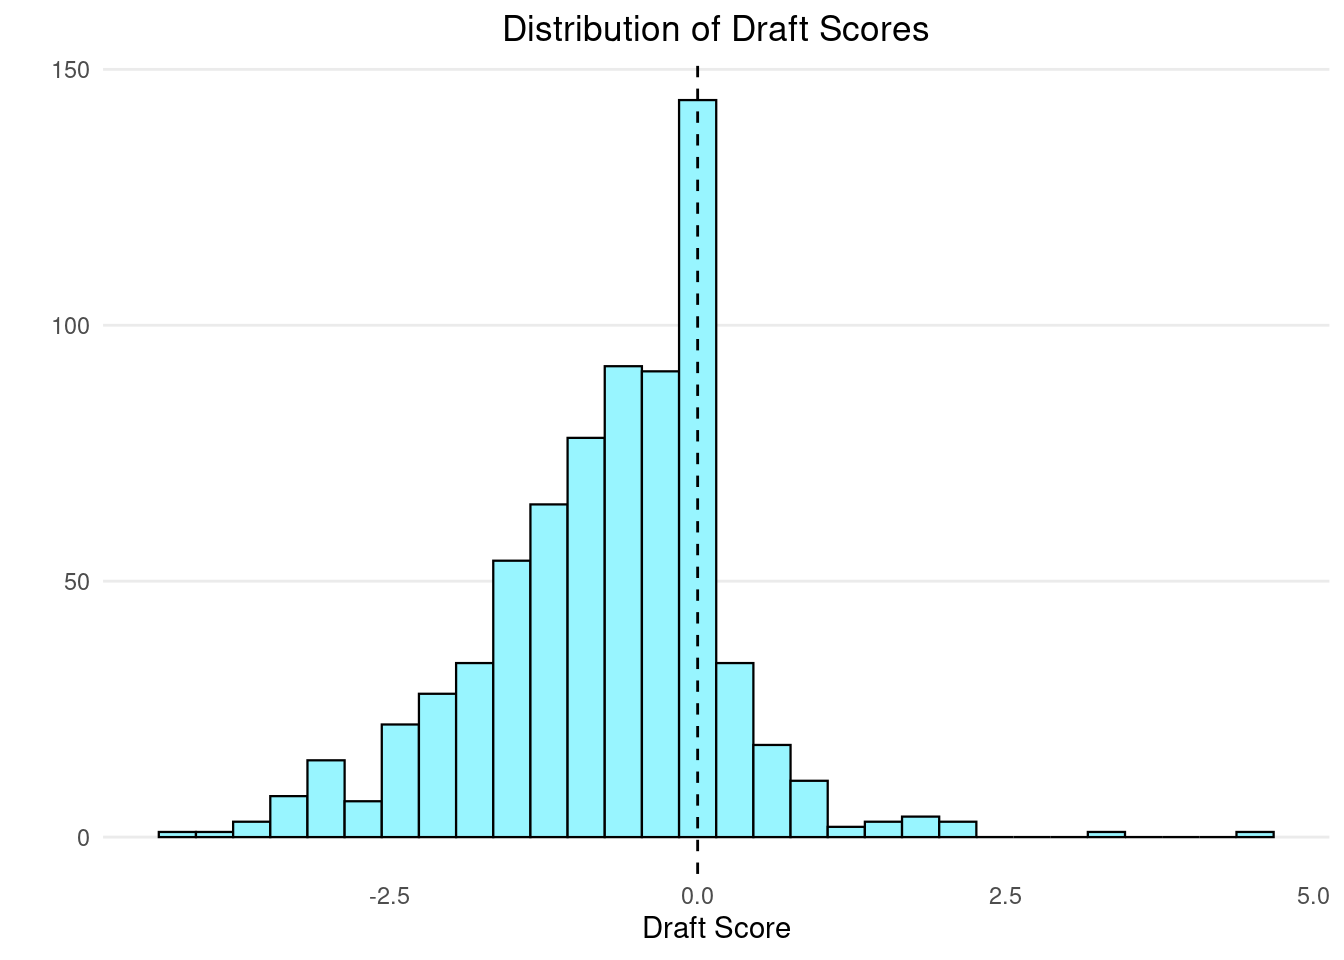
Among the 720 draft picks analyzed, Ben Simmons stood out above the rest. In his debut season he had a Win Share (WS) of 9.2 and won Rookie of the Year (ROTY). On the other end of the spectrum, Thomas Robinson (5th pick in 2012 by the Sacramento Kings) ranks worse than all other draft picks, followed by Luka Šamanić (19th pick in 2019 by the San Antonio Spurs). While Robinson went on to become a reliable role player a few years after, the Sacramento Kings passed on Damian Lillard and Andre Drummond. The enormous opportunity cost of acquiring Robinson is the reason for his low score.
Despite skewness, a draft score of zero is most common - a fairly typical drafy score that is neither bad nor good. Many of these draft picks are second round picks with low expectations and correspondingly low value performance.
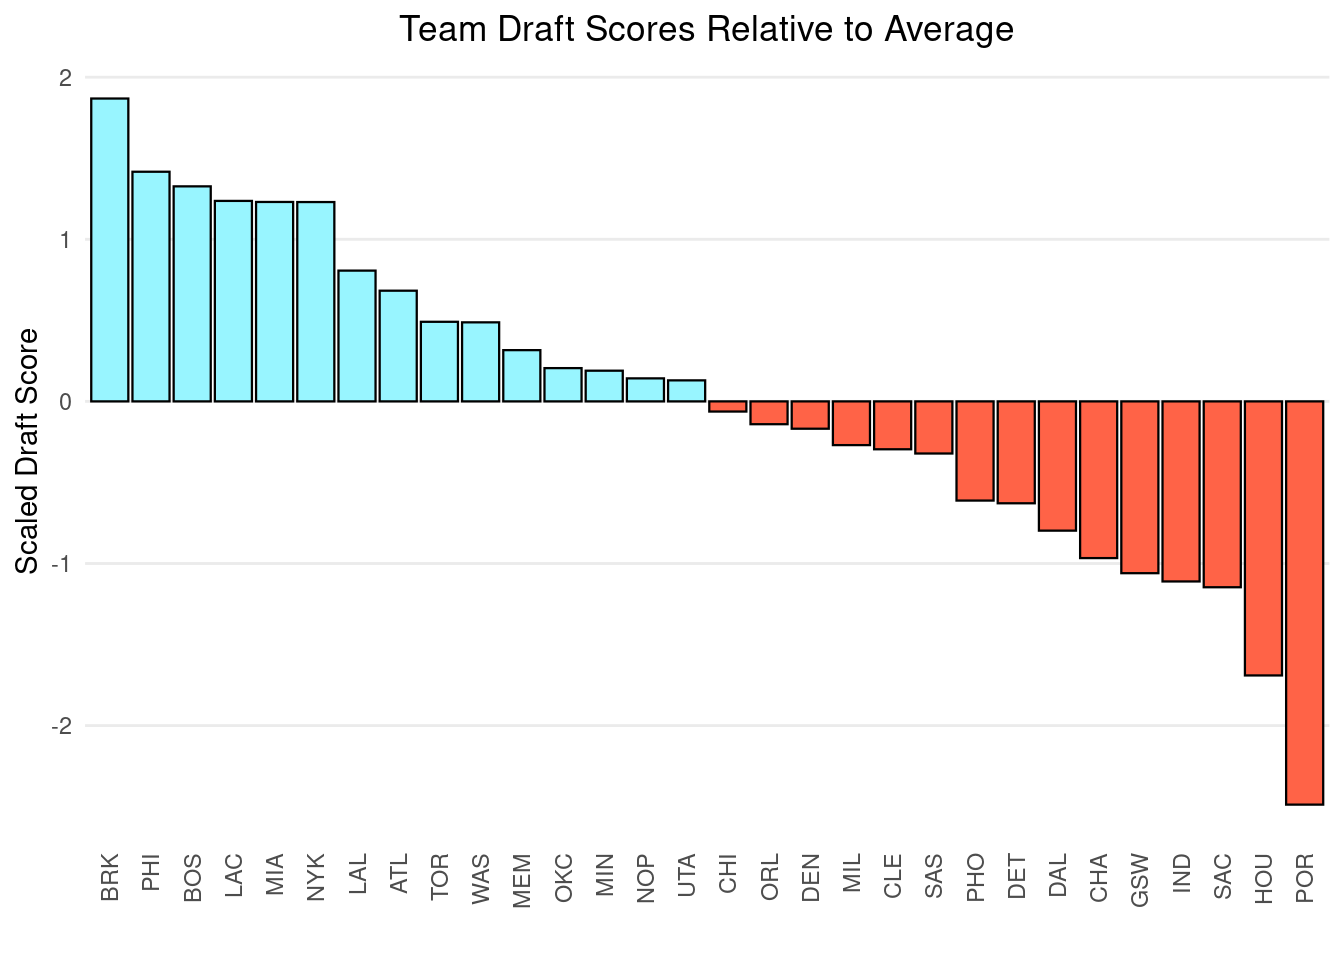
The Brooklyn Nets are the best team in the NBA at drafting quick impact players while the Portland Trailblazers are the worst. The Philadelphia 76ers rank second and, to no surprise, the Boston Celtics are also among the top teams in third.
The ten top draft picks in the NBA:
| Pick | Team | Player | Draft | WS | Draft Score |
|---|---|---|---|---|---|
| 1 | PHI | Ben Simmons | 2016 | 9.2 | 4.407546 |
| 1 | MIN | Karl-Anthony Towns | 2015 | 8.3 | 3.385626 |
| 3 | BOS | Jayson Tatum | 2017 | 7.1 | 2.179591 |
| 39 | NYK | Landry Fields | 2010 | 5.3 | 2.091966 |
| 36 | NYK | Mitchell Robinson | 2018 | 6.1 | 2.004850 |
| 1 | LAC | Blake Griffin | 2009 | 9.8 | 1.802296 |
| 41 | DEN | Nikola Jokić | 2014 | 6.7 | 1.785656 |
| 2 | MEM | Ja Morant | 2019 | 3.8 | 1.785075 |
| 7 | DET | Greg Monroe | 2010 | 6.6 | 1.731611 |
| 23 | CHI | Nikola Mirotić | 2011 | 5.7 | 1.586000 |
Among the best draft picks, Ben Simmons and Karl-Anthony Towns stick out as first overall selections. Their high score is primarily due to the poor performance of the players drafted after them combined with their own impressive stats.
Among the ten worst draft selections, they seem to be concentrated around the late lottery or right outside it.
| Pick | Team | Player | Draft | WS | Draft Score |
|---|---|---|---|---|---|
| 5 | SAC | Thomas Robinson | 2012 | 0.0 | -4.339822 |
| 19 | SAS | Luka Šamanić | 2019 | 0.0 | -4.006309 |
| 19 | CLE | Sergey Karasev | 2013 | 0.0 | -3.740151 |
| 21 | POR | Nolan Smith | 2011 | 0.0 | -3.617248 |
| 40 | MIN | Glenn Robinson III | 2014 | 0.1 | -3.559931 |
| 6 | GSW | Ekpe Udoh | 2010 | 0.7 | -3.437659 |
| 14 | HOU | Marcus Morris | 2011 | 0.0 | -3.425944 |
| 18 | IND | T.J. Leaf | 2017 | 0.8 | -3.424305 |
| 15 | ORL | Cole Anthony | 2020 | 0.0 | -3.399691 |
| 9 | NYK | Kevin Knox | 2018 | 0.0 | -3.287380 |
The best selection by each team:
| Pick | Team | Player | Draft | WS | Draft Score |
|---|---|---|---|---|---|
| 1 | PHI | Ben Simmons | 2016 | 9.2 | 4.4075455 |
| 1 | MIN | Karl-Anthony Towns | 2015 | 8.3 | 3.3856260 |
| 3 | BOS | Jayson Tatum | 2017 | 7.1 | 2.1795912 |
| 39 | NYK | Landry Fields | 2010 | 5.3 | 2.0919656 |
| 1 | LAC | Blake Griffin | 2009 | 9.8 | 1.8022959 |
| 41 | DEN | Nikola Jokić | 2014 | 6.7 | 1.7856565 |
| 2 | MEM | Ja Morant | 2019 | 3.8 | 1.7850751 |
| 7 | DET | Greg Monroe | 2010 | 6.6 | 1.7316109 |
| 23 | CHI | Nikola Mirotić | 2011 | 5.7 | 1.5859996 |
| 1 | NOP | Anthony Davis | 2012 | 6.1 | 1.5647690 |
| 60 | SAC | Isaiah Thomas | 2011 | 4.3 | 1.5059783 |
| 36 | MIL | Malcolm Brogdon | 2016 | 4.1 | 1.2159849 |
| 46 | LAL | Jordan Clarkson | 2014 | 2.4 | 1.0347651 |
| 52 | HOU | Kenyon Martin Jr. | 2020 | 2.2 | 0.9278374 |
| 38 | GSW | Patrick McCaw | 2016 | 1.7 | 0.8482580 |
| 50 | MIA | James Ennis III | 2013 | 1.9 | 0.7679009 |
| 23 | WAS | Trevor Booker | 2010 | 2.6 | 0.6819243 |
| 32 | OKC | Álex Abrines | 2013 | 2.1 | 0.6234164 |
| 1 | CLE | Kyrie Irving | 2011 | 4.1 | 0.6188489 |
| 55 | UTA | Jeremy Evans | 2010 | 1.6 | 0.5152225 |
| 10 | ORL | Elfrid Payton | 2014 | 2.3 | 0.4940723 |
| 46 | TOR | Norman Powell | 2015 | 1.6 | 0.4547951 |
| 60 | BRK | Cory Jefferson | 2014 | 0.8 | 0.3740957 |
| 53 | SAS | Nando De Colo | 2009 | 1.3 | 0.3450508 |
| 1 | PHO | Deandre Ayton | 2018 | 5.8 | 0.3258348 |
| 52 | CHA | Jalen McDaniels | 2019 | 0.5 | 0.2385953 |
| 23 | ATL | John Jenkins | 2012 | 1.7 | 0.2225307 |
| 56 | DAL | Ray Spalding | 2018 | 0.2 | 0.0441336 |
| 6 | POR | Damian Lillard | 2012 | 5.8 | 0.0167117 |
| 52 | IND | A.J. Price | 2009 | 1.2 | -0.0282679 |
And the worst selection by each team:
| Pick | Team | Player | Draft | WS | Draft Score |
|---|---|---|---|---|---|
| 5 | SAC | Thomas Robinson | 2012 | 0.0 | -4.339822 |
| 19 | SAS | Luka Šamanić | 2019 | 0.0 | -4.006309 |
| 19 | CLE | Sergey Karasev | 2013 | 0.0 | -3.740151 |
| 21 | POR | Nolan Smith | 2011 | 0.0 | -3.617248 |
| 40 | MIN | Glenn Robinson III | 2014 | 0.1 | -3.559931 |
| 6 | GSW | Ekpe Udoh | 2010 | 0.7 | -3.437659 |
| 14 | HOU | Marcus Morris | 2011 | 0.0 | -3.425944 |
| 18 | IND | T.J. Leaf | 2017 | 0.8 | -3.424305 |
| 15 | ORL | Cole Anthony | 2020 | 0.0 | -3.399691 |
| 9 | NYK | Kevin Knox | 2018 | 0.0 | -3.287380 |
| 24 | DEN | R.J. Hampton | 2020 | 0.4 | -3.266809 |
| 8 | DET | Stanley Johnson | 2015 | 0.6 | -3.257642 |
| 32 | MEM | Jevon Carter | 2018 | 0.0 | -3.207776 |
| 11 | CHA | Malik Monk | 2017 | 0.0 | -3.152257 |
| 20 | CHI | Tony Snell | 2013 | 1.6 | -2.979016 |
| 39 | PHI | Jerami Grant | 2014 | 0.5 | -2.956900 |
| 17 | NOP | Nickeil Alexander-Walker | 2019 | 0.0 | -2.933173 |
| 18 | DAL | Josh Green | 2020 | 0.5 | -2.914159 |
| 17 | OKC | Aleksej Pokusevski | 2020 | 0.0 | -2.898166 |
| 31 | PHO | Elie Okobo | 2018 | 0.0 | -2.895894 |
| 17 | MIL | D.J. Wilson | 2017 | 0.1 | -2.879525 |
| 35 | BOS | Rade Zagorac | 2016 | 0.0 | -2.805361 |
| 37 | TOR | DeAndre Daniels | 2014 | 0.0 | -2.753044 |
| 10 | ATL | Cam Reddish | 2019 | 0.0 | -2.497077 |
| 27 | UTA | Udoka Azubuike | 2020 | 0.1 | -2.231914 |
| 34 | LAL | Anthony Brown | 2015 | 0.0 | -2.206850 |
| 37 | LAC | Trey Thompkins | 2011 | 0.0 | -2.187769 |
| 32 | WAS | Tomáš Satoranský | 2012 | 0.6 | -2.122493 |
| 10 | MIA | Justise Winslow | 2015 | 2.5 | -1.837147 |
| 29 | BRK | Džanan Musa | 2018 | 0.0 | -1.440580 |
Methodology
The central idea behind this analysis is relatively simple: to evaluate draft selections, players should be compared against the alternatives available. If better players were available, then the draft pick can be considered bad. If better players were not available - or were drafted too far back to have been realistically considered at that draft position - then the draft selection was a good one.
It doesn’t matter how well players drafted in that position normally perform - in fact, you’ll find this methodology sometimes grades players considered disappointing as decent draft picks because the players taken next were even worse. For example, Andrew Wiggins actually receives a positive draft score because Cleveland avoided drafting Jabari Parker (2nd overall), who was far worse.
Therefore, the performance of each player drafted is compared against a weighted average of the players drafted after. Players who are drafted closer are given higher weights than players drafted further away since they were more likely to have been considered as alternatives at that position.
Some adjustments were made around which teams draft picks were attributed to. While a player is officially listed under the team that drafted them, if they were traded on draft night or any time before the beginning of the following season, I attributed the draft pick to the team that they were traded to. Any trades after that point did not affect attribution.
In order to measure player performance, the advanced statistic of Win Shares (WS) was employed. Win Shares is a player statistic which attempts to divvy up credit for team success to the individuals on the team. Win Shares are calculated using player, team, and league-wide statistics and the sum of player win shares on a given team will be roughly equal to that team’s win total for the season. Moreover, any WS values below zero are replaced by zero. A player that played poorly should not be considered worse than one that never played at all.
To form the weights, I use a modified version of Brown’s simple exponential smoothing model:
\[V^C_{yd} = V_{y(d+1)} +(1-\alpha_d)V_{y(d+2)} + (1-\alpha_d)^2V_{y(d+3)} + \dots \]
Where \(V\) represents the counterfactual (\(C\)) value (\(V\)) at draft position \(d\) in year \(y\). Alpha represents the smoothing factor at \(d\), which must be between zero and one. A high alpha places more weight on the players drafted closer while a low alpha spreads the weight more evenly among many players. The alpha is multiplied by the actual Value (\(V\)) of the player taken at \(d + 1\) (directly after) in year \(y\).
However, the alpha is not consistent across draft selections within any one year (though it is consistent in the same draft position across years). In top draft spots, there is usually only a very small number of players that could conceivably be drafted. In later draft positions, there is a large number of players could be considered. This can easily be seen by comparing actual draft positions against ESPN rankings of the best draft prospects. In early draft positions, ESPN rankings closely align with actual draft positions. By the second round, there are often huge variations between the two.
Therefore, each draft position has a unique smoothing factor. First, I determined the absolute difference between the actual draft position and the ESPN best player ranking of the same player for every draft between 2014 and 2020. In the rare instance a player not ranked by ESPN is drafted, their ranking was recorded as 101. I then found the average for each draft position and regressed this against actual draft position. The Beta coefficient was 0.317, which is then input into the following equation to the determine the alpha for each draft position:
\[\alpha_d = \frac{1}{0.317d+1}\]
Which yields alphas that decline at later draft positions. This approach gives a considerably higher alpha for the very top draft picks but considerably lower alpha for those in the second round. The end result is that the scores of top draft picks rely heavily on the performance of the players drafted directly after while the scores of later draft picks are compared more evenly to many players.
The alpha is used to calculate the counterfactual performance for each player. By subtracting the actual value from counterfactual value, the Net Rating for each player is determined.
\[NR_{yd} = V_{yd} - V^C_{yd} \]
The Net Rating can be thought of as the “excess value” a draft selection generated against the likely alternatives available.
To make draft scores comparable across draft years, I use z-scoring by dividing the Net Rating of each player in each year against the standard deviation of the net ratings within that year:
\[\text{Draft Score} = \frac{NR_{yd}}{\sigma_{y}^{NR}}\]
As always, if you have a question or a suggestion related to the topic covered in this article, please feel free to contact me!