The Ethics of Data Visualizations
With the burgeoning relevance of big data in nearly every person’s life, data scientist’s carry the heavy burden of analyzing and portraying data in a honest and ethical way, especially in the context of government policy and healthcare where lives are, quite literally, on the line.
The ethical responsibilities of a data scientist are present in every step of the workflow of a particular data set. For example, during data analysis several questions may arise: Should I delete this entry during data clean-up? Am I succumbing to confirmation bias? Does my analysis unfairly bias a certain group? However, the concerns don’t end once the data has been investigated and the analysis is decidedly fair and honest. In fact, the next step has more murky ethical quandaries than the last and this is when a data scientist must be most vigilant to one’s own deceptive tendencies.
The delivery and presentation of results, most particularly through data visualization is a step where a data scientist may behave unethically without even realizing it. This is because we, as data scientists, have a responsibility to portray our findings in a clear, non-biased way and the decisions we make during this process can bias our message to our audience. The purpose of this article is to bring to attention various pitfalls that could be made during the visualization process and to urge a constant awareness to the way graphs and figures could be perceived.
Data visualizations can be essential tools for exploring and communicating complicated information — or they can obfuscate, distort, or misrepresent data. Misleading data visualizations might be intentional, if the creator has an agenda to promote; or they might be the result of errors, the creator not understanding the data or the data visualization process, or allowing engaging or even beautiful visual design to get in the way of clear communication.
There are two main ways a figure with accurate data could delude a viewer:
- Delivering a an exaggerated/understated message
- Imparting the reverse of the message contained in the data
Here is a pair of bar plots displaying the same exact data:
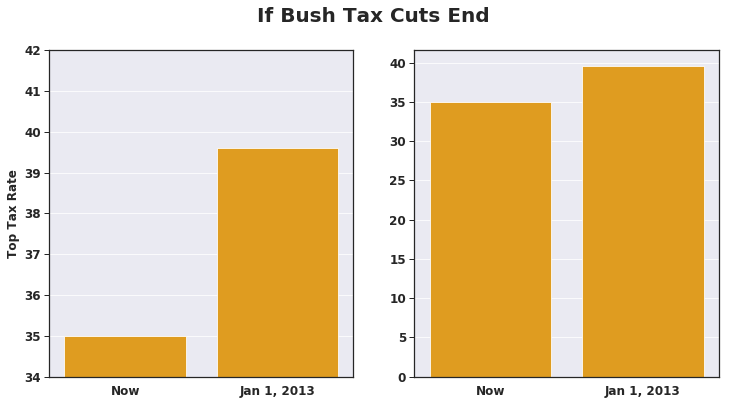
These two graphs were used by major news networks to make opposing points. The data shown on the left was used to emphasize the difference between the top tax rates if Bush-era tax breaks were ended. The audience is then left with the impression that the difference is much greater than in reality. Although the data presented is the same, the reader interprets them differently. To avoid this, it is recommended to always include 0 on the y-axis to make sure the relative differences are accurate.
Another example is by illustrating quantity as a dimension rather than an area, which is particularly relevant in bubble plots:
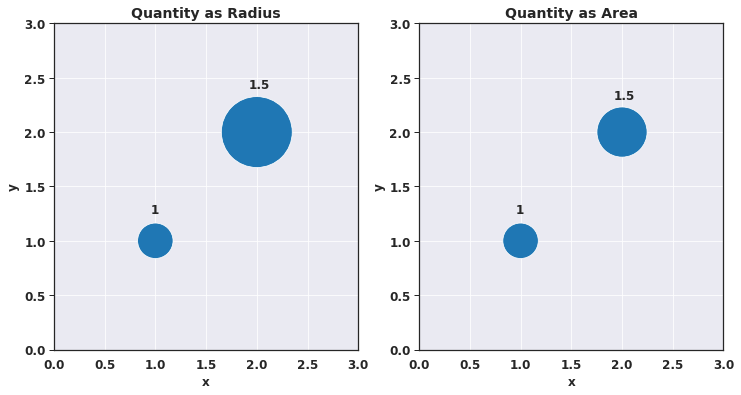
The graph on the left appears to show a much larger increase between the smaller bubble and the larger bubble when compared to the graph on the right. By using the radius instead of the area for the y-axis, the perceived difference in values is much larger than in the data. This is due to the area being proportional to the square of the radius and therefore is not a linear relationship, deceiving the reader to believe the increase is larger than it is. Areas can be used to make one-to-one comparisons while something such as radius is misleading. When using size as 3rd dimension in graphs, one should always use area on the y-value, no matter the shape.
The above were all examples of techniques that can deceive an audience to believe that a message is stronger than the data shows and are all unethical in their own right. However, the next example is even worse as it shows a case where the viewer may walk away with the reverse message:
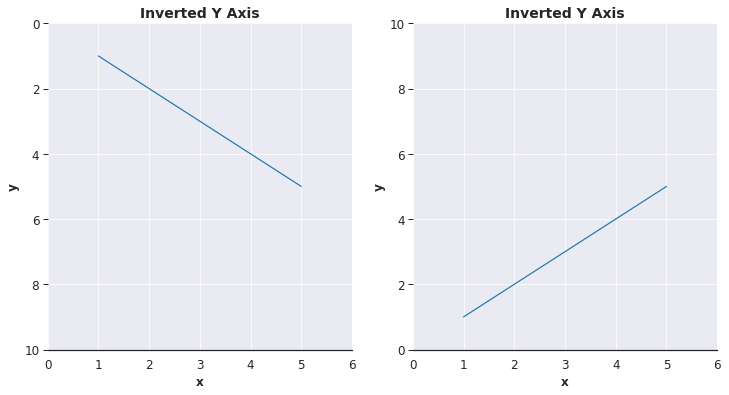
The effect shown here is that of inverting the y-axis. Here, it appears that the the x and y variables have a negative relationship where in fact the data actually has a positive relationship. The inversion of the y-axis is non-standard in graphs and one should always use the Cartesian coordinate system in any sort of graph to avoid the audience to walk away thinking the opposite message of what the data shows.
One of the most misleading graphs I have ever come across, used this technique:
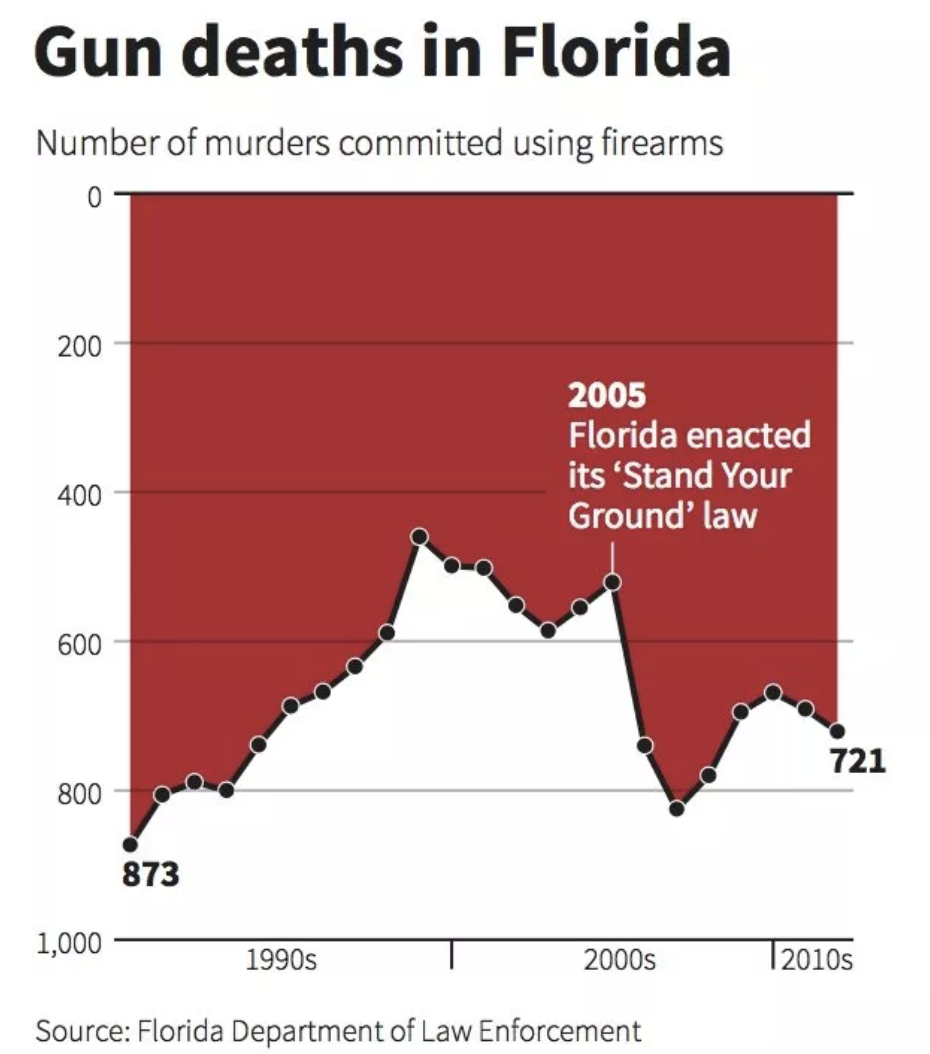
The graph is actually an upside-down version of what it should be! At first glance, it seems that gun deaths in Florida were going down when in actuality, it was spiking.
All of these deception techniques actually influence the reader’s views of the message and this has been shown by an empirical study preformed by Pandey, et al (2015). And these are by no means an exhaustive list of deceptive techniques in data visualization.
Finally, we have a responsibility to make our visualizations as accessible as possible. After all, if the reader cannot see the graph well it may be misleading. We must keep this in mind when choosing fonts, sizes, labels, and colors. An easy way to handle the color problem is to use the R package RColorBrewer, which has a ton of color-blind friendly palettes.
RColorBrewer::display.brewer.all(colorblindFriendly = T)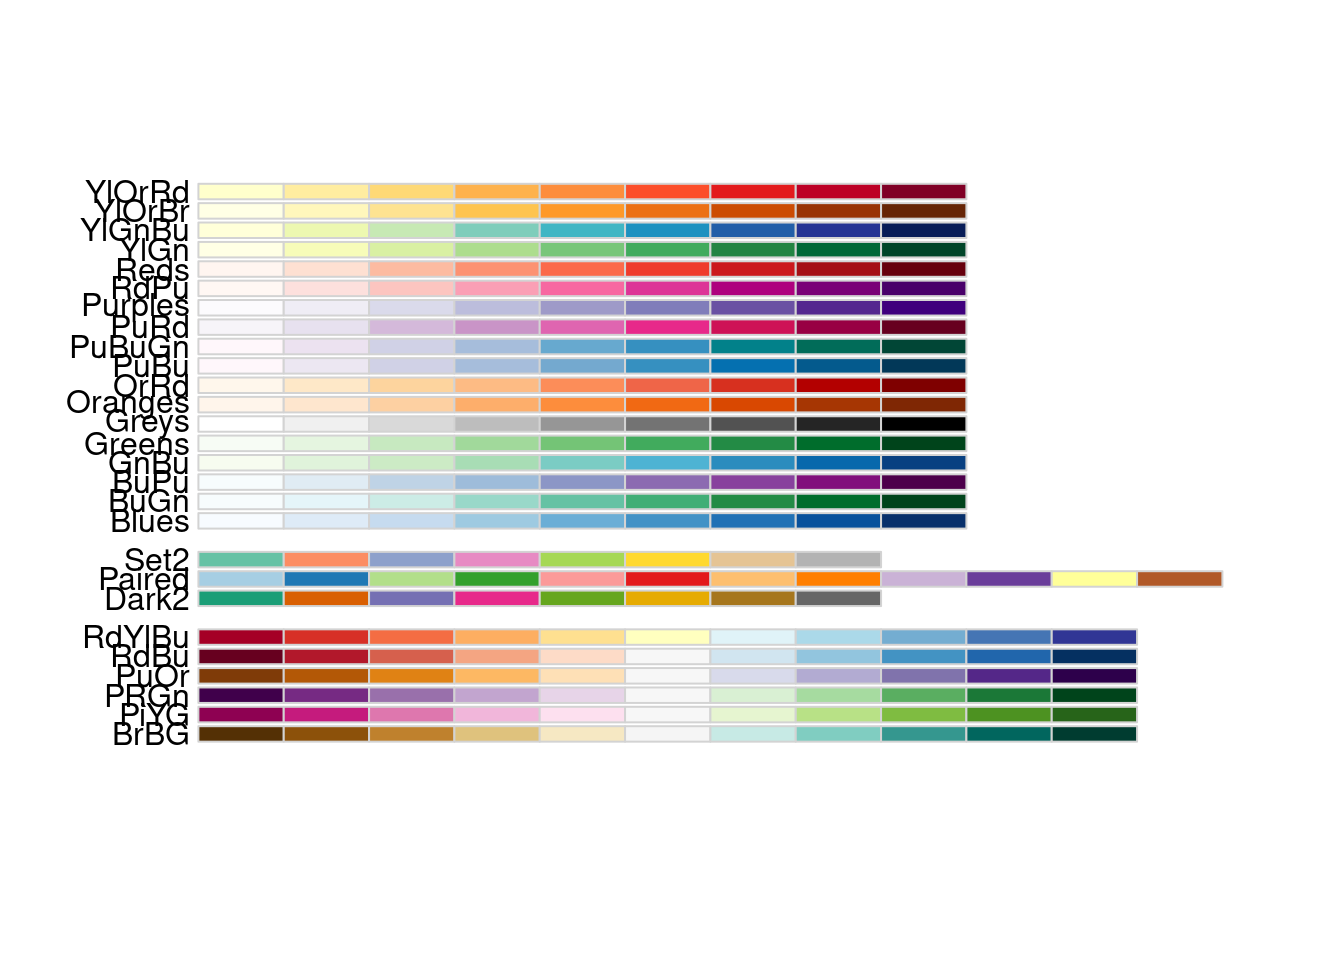
The many ways that data visualizations can go wrong is not an argument for avoiding them. Data visualizations can enhance insights and make complex information clear and instantly accessible to many. Choosing an appropriate format for data visualizations and applying sound visual design principles can go a long way toward avoiding misleading data visualizations. As data scientists we must dig deep into the potential that our graphs, however well intentioned, may be deceiving our audience in an unethical manner. After all, many times we will be leaned on as the expert on the data we are presenting and have a responsibility to display our findings in as clear and honest way as possible.
With the purpose of providing a guide for the ethical practice of data science, DataPractices.org published the Data Values and Principles manifesto. It embraces four values (inclusion, experimentation, accountability, and impact) along with 12 principles:
- Use data to improve life for our users, customers, organizations, and communities.
- Create reproducible and extensible work.
- Build teams with diverse ideas, backgrounds, and strengths.
- Prioritize the continuous collection and availability of discussions and metadata.
- Clearly identify the questions and objectives that drive each project and use to guide both planning and refinement.
- Be open to changing our methods and conclusions in response to new knowledge.
- Recognize and mitigate bias in ourselves and in the data we use.
- Present our work in ways that empower others to make better-informed decisions.
- Consider carefully the ethical implications of choices we make when using data, and the impacts of our work on individuals and society.
- Respect and invite fair criticism while promoting the identification and open discussion of errors, risks, and unintended consequences of our work.
- Protect the privacy and security of individuals represented in our data.
- Help others to understand the most useful and appropriate applications of data to solve real-world problems.
Currently, this document has over 2,200 signatories. Along with your help, we hope these practices will become widespread.
As always, if you have a question or a suggestion related to the topic covered in this article, please feel free to contact me!